TRID Tips For Agents

TRID TIPS FOR AGENTS 

Information sellers should be aware of:

1. Seller costs will not delay the closing –get them up front and to closing attorney as soon as possible.

2. Delays could occur if the buyer CD is affected –double check Lender quality with your WRM lo or refer WRM to preapprove buyers for seller’s needs.

3. It makes sense to eliminate risk wherever possible. Therefore, the following suggestions may be worthwhile sharing with sellers:

a. May want to consider conveying the home with a full oil tank, rather a late measure.

b. Hold backs and “side agreements” are no longer allowed. All agreements must be reflected on the CD (Closing Disclosure) and communicated with the lender well in advance.

c. If a seller does work, it should complete work in ample time (3 weeks prior to closing), by a licensed Pro and lender will need paid in full receipt.

d. Seller should be prepared to allow for more than one walk through / inspection if needed.

4. Sellers should start there move as quick as they can and not wait until the last minute.

5. William Raveis mortgage can review any preapproval at anytime for your sellers and we can also be available to pre-approve buyers if the seller wishes.

General information for both sellers and buyers (and you):
1. Closing will not likely take place at the registry. This is due to managing any last minute changes made the CD. Prepare for attorney office closing and our WR office.

2. Try to avoid closings on the last day of the month, early in week is preferred as well or mid- month.

3. Make sure your license number is on purchase and sale. This could delay the CD

4. Going forward, the Admin will complete the commission statement at the time of the P & S and forward it to you. They will also include your license number on this document. Please review for accuracy it and forward to the closing attorney early in the process.

5. Saturday is considered a business day, but closings cannot take place on a Saturday or after hours.

6. Advise the other agent of these changes and be diligent.

Questions to buyers who are not using William Raveis Mortgage, you need to ask:

1. How will the CD be dispersed? (Snail mail , email , etc)?

2. How will you be notified once the CD is sent to the buyer?

3. When will the Title be ordered?

4. Can your “go to” attorney do the closing or does the bank have a closed list?

5. Can the lender make same day changes to the CD?


I’m Going to be on WBZ AM 1030!

Recording at WBZ Radio AM 1030 to promote my upcoming charity event with Dr. Ryan Corcoran with The Damon Runyon Cancer Research Foundation from MGH Boston, for my upcoming cancer charity event!!!! LISTEN to me Saturday 8/15/15 from 8:00-9:00am. If you’d like to support me please feel free to visit my donation page: http://raveisrideandwalkma.crowdsterapp.com/evanwalsh #boston #Dover #medfield #needham #natick #sherborn #newton #wellesley #weston #westwood #wayland #Hingham #cancer #cancerresearch #damonrunyon #raveis #raveisridewalk   
   

Major Federal Changes to Residential Mortgage Forms

What are the major federal changes to the residential mortgage forms and loan rules will take place starting October 3rd this year?For over two years the real estate, mortgage, and title industries have been preparing for the implementation of the rules imposed by the Dodd Frank Act. The Consumer Financial Protection Bureau (CFPB) is tasked with implementing the New Rule. The CFPB’s goal is to aid consumer understanding of the often technical real estate disclosures while maintaining compliance with existing requirements like the Real Estate Settlement and Procedures Act (RESPA) and the Truth in Lending Act (TILA). 


Simply put: THE CFPB is changing the process by which consumers receive their disclosure forms when purchasing a home, and they are making the forms easier to read by changing the language and the graphical layout of the forms themselves. 


Mortgage companies are now mandated to send the consumer a “Loan Estimate” within three days of the consumer providing very basic information to them. Six pieces of information to be exact: their name, social security number, income, desired loan amount, property value, property address. The Loan Estimate will combine today’s Truth in Lending form and the initial Good Faith Estimate into one easy to read form that will help consumers understand all of the costs of the transaction. 


Another new form that is introduced with the new Rule is the Closing Disclosure. 


Built from the same principals as the Loan Estimate, the Closing Disclosure replaces the final GFE and HUD form, again making the cost of the transaction easier for the consumer to understand, and is to be received by the consumer no less than three days prior to the consummation of the loan. The goal is to give the consumer time to compare the figures on the closing disclosure with those on the Loan Estimate that was provided upfront. With the implementation of this law there are also certain fees that cannot change, or can only change a certain amount. The lenders origination charge for example cannot change, and the attorney’s closing fee cannot vary by more than 10% than the figure that was provided on the upfront Loan Estimate.  


It’s important to note, that the three days referenced above is a mandatory waiting period, so if there are any changes to the transaction fees that exceed the tolerances set by the new Rule that a new 3 day waiting period may be declared (as mandated by the Dodd Frank Rule) and closing dates could potentially be pushed back. With so many parties coming together to meet mandatory deadlines, it is important for consumers to choose a real estate team that works closely together (i.e. an attorney, a realtor, and a mortgage banker) in order to assure that there is good processes and communication to assure that the deadlines that they set for the issuance of these new forms is met and their closing dates remain firm.


The new Rule goes into effect for new loan applications as of October 3rd. 

WESTWOOD, MA : MARKET DATA THROUGH APRIL

April Headlines

Westwood
  • Days on market in April was 148. This is up 393.3% from 30 in April of 2014.
  • Median price is up by 42.8%.
  • New listings are up 50.0% to 36.
Nearby Areas You May Be Interested In
  • Median price in Milton is up by 77.2%.
  • Median price in Walpole is up 75.8% to $738,500.
  • Days on market in Needham in April was 98. This is up 276.9% from 26 in April of 2014.
Changes Favoring Buyers
3 Months Ending April, 2015 % Chg From Apr, 2014
Market Time (Days) 124 125.5%
Price per Sq Ft for Sold $290 -9.9%
Sales to List Price Ratio 96.4% -2.2%
Listings Under Contract 42 -6.7%
Changes Favoring Sellers
3 Months Ending April, 2015 % Chg From Apr, 2014
Unit Sales 29 3.6%
Median Sale Price $685,000 15.9%
Inventory 49 -5.8%
Months of Supply 4.0 -1.1%
New Listings 65 -9.7%

Sales

There were 15 unit sales in April. This is up 7.1% from 14 in April of 2014. Sales/list price ratio in April moved up to 97.4% from 97.3% in March.

chart

Prices

Median price in April was $707,000. This is up 42.8% from $495,000 in April of 2014. 3-month median price of $685,000 in April was up modestly from $597,500 in March and up a little from $591,250 in April of 2014. Price per square foot in April was $276. This is down from $314 in March and down from $315 in April of 2014.

chart

Inventory

Inventory of 61 in April was up 35.6% from 45 in March and up 8.9% from 56 in April of 2014. New listings of 36 in April were way up from 18 in March and up substantially from 24 in April of 2014. Months of supply of 4.9 in April was up considerably from 3.6 in March and up slightly from 4.3 in April of 2014. This is the highest months of supply has been since November, 2014.

chart

Market Time

Days on market of 148 in April was up substantially from 64 in March and up considerably from 30 in April of 2014. This is the highest days on market has been since March, 2013.

chart

Change in Median Sale Price for Single Family Properties YTD From 2014 To 2015 for Towns in Norfolk County Ranked by Best Performance
Town % Change
Cohasset 39.91%
Needham 25.71%
Milton 24.74%
Wrentham 22.67%
Foxborough 17.74%
Brookline 16.88%
Westwood 12.52%
Walpole 11.02%
Medfield 9.44%
Holbrook 9.17%

WESTON, MA : MARKET DATA THROUGH APRIL

April Headlines

Weston
  • Median price is down by 28.5%.
  • 3-month days on market is up 86.7% to 168.
  • Unit sales in April were 4. This is down 60.0% from 10 in April of 2014.
Nearby Areas You May Be Interested In
  • Unit sales in Wellesley are down 40.9% to 13.
  • Median price in Wellesley in April was $1,189,000. This is down 22.7% from $1,538,800 in April of 2014.
  • Unit sales in Dover are down by 60.0%.
Changes Favoring Buyers
3 Months Ending April, 2015 % Chg From Apr, 2014
Median Sale Price $1,192,500 -18.0%
Market Time (Days) 168 86.7%
Sales to List Price Ratio 94.6% -1.8%
Listings Under Contract 29 -27.5%
Changes Favoring Sellers
3 Months Ending April, 2015 % Chg From Apr, 2014
Unit Sales 24 9.1%
Inventory 81 -9.0%
Months of Supply 6.2 -6.4%
Price per Sq Ft for Sold $378 1.4%
New Listings 88 -11.1%

Sales

There were 4 unit sales in April. This is down 60.0% from 10 in April of 2014. Sales/list price ratio in April moved down to 94.1% from 96.6% in March.

chart

Prices

Median price in April was $1,107,500. This is down 28.5% from $1,550,000 in April of 2014. This is the lowest median price has been since November, 2014. 3-month median price this month is $1,192,500, the same as last month. Price per square foot in April was $353. This is down from $372 in March and down from $414 in April of 2014.

chart

Inventory

Inventory of 104 in April was up 30.0% from 80 in March but down 1.9% from 106 in April of 2014. New listings in April were 42, unchanged from the same month last year. Months of supply of 8.2 in April was up considerably from 6.1 in March and up slightly from 7.8 in April of 2014. This is the highest months of supply has been since September, 2014.

chart

Market Time

Days on market of 210 in April was up substantially from 136 in March and up considerably from 66 in April of 2014. This is the highest days on market has been since November, 2012.

chart

Change in Median Sale Price for Single Family Properties YTD From 2014 To 2015 for Towns in Middlesex County Ranked by Best Performance
Town % Change
Cambridge 38.46%
Newton 24.92%
Stoneham 21.81%
Lowell 14.80%
Malden 14.72%
Hopkinton 13.40%
Wilmington 13.33%
Woburn 13.00%
Melrose 12.05%
Billerica 10.71%


WELLESLEY, MA : MARKET DATA THROUGH APRIL

April Headlines

Wellesley
  • Unit sales are down by 40.9%.
  • Median price is down 22.7% to $1,189,000.
  • Months of supply in April was 4.7. This is up 25.3% from 3.8 in April of 2014.
Nearby Areas You May Be Interested In
  • Days on market in Needham is up 276.9% to 98.
  • Months of supply in Winchester in April was 4.4. This is up 109.1% from 2.1 in April of 2014.
  • Inventory in Winchester is up by 71.8%.
Changes Favoring Buyers
3 Months Ending April, 2015 % Chg From Apr, 2014
Unit Sales 47 -16.1%
Median Sale Price $1,332,500 -4.6%
Inventory 94 1.1%
Months of Supply 3.6 8.9%
Sales to List Price Ratio 92.7% -6.1%
New Listings 160 11.9%
Listings Under Contract 87 -11.2%
Changes Favoring Sellers
3 Months Ending April, 2015 % Chg From Apr, 2014
Market Time (Days) 105 -8.7%
Price per Sq Ft for Sold $403 1.8%

Sales

There were 13 unit sales in April. This is down 40.9% from 22 in April of 2014. Sales/list price ratio in April moved down to 96.8% from 97.2% in March.

chart

Prices

Median price in April was $1,189,000. This is down 22.7% from $1,538,800 in April of 2014. This is the lowest median price has been since September, 2014. 3-month median price of $1,332,500 in April was down marginally from $1,345,000 in March and down a little from $1,396,500 in April of 2014. Price per square foot in April was $454. This is up from $391 in March and up from $400 in April of 2014.

chart

Inventory

Inventory of 120 in April was up 33.3% from 90 in March and up 12.1% from 107 in April of 2014. New listings of 83 in April were up substantially from 57 in March and way up from 61 in April of 2014. Months of supply of 4.7 in April was up considerably from 3.4 in March and up moderately from 3.8 in April of 2014. This is the highest months of supply has been since October, 2014.

chart

Market Time

Days on market of 104 in April was up slightly from 89 in March but down considerably from 137 in April of 2014.

chart

Change in Median Sale Price for Single Family Properties YTD From 2014 To 2015 for Towns in Norfolk County Ranked by Best Performance
Town % Change
Cohasset 39.91%
Needham 25.71%
Milton 24.74%
Wrentham 22.67%
Foxborough 17.74%
Brookline 16.88%
Westwood 12.52%
Walpole 11.02%
Medfield 9.44%
Holbrook 9.17%

WAYLAND, MA : MARKET DATA THROUGH APRIL

April Headlines

Wayland
  • 3-month unit sales are up 68.8% to 27.
  • Months of supply in April was 6.1. This is up 61.3% from 3.8 in April of 2014.
  • New listings are up by 62.5%.
Nearby Areas You May Be Interested In
  • Unit sales in Medfield in April were 19. This is up 90.0% from 10 in April of 2014.
  • Days on market in Westwood is up by 393.3%.
  • Months of supply in Bedford is up 92.4% to 4.5.
Changes Favoring Buyers
3 Months Ending April, 2015 % Chg From Apr, 2014
Inventory 50 13.6%
Months of Supply 4.3 42.9%
Market Time (Days) 123 9.8%
Price per Sq Ft for Sold $257 -5.2%
Sales to List Price Ratio 94.5% -4.3%
New Listings 80 19.4%
Changes Favoring Sellers
3 Months Ending April, 2015 % Chg From Apr, 2014
Unit Sales 27 68.8%
Median Sale Price $608,500 2.3%
Listings Under Contract 36 2.9%

Sales

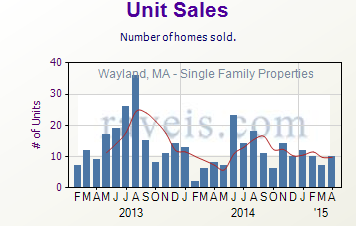
There were 10 unit sales in April. This is up 25.0% from 8 in April of 2014. Sales/list price ratio in April moved down to 94.5% from 95.1% in March.

chart

Prices

Median price in April was $612,000. This is down 7.0% from $657,938 in April of 2014. 3-month median price of $608,500 in April was up marginally from $585,000 in March and very slightly up from $595,000 in April of 2014. Price per square foot in April was $255. This is down from $257 in March and down from $259 in April of 2014.

chart

Inventory

Inventory of 72 in April was up 71.4% from 42 in March and up 30.9% from 55 in April of 2014. New listings of 52 in April were up substantially from 21 in March and way up from 32 in April of 2014. Months of supply of 6.1 in April was up considerably from 3.6 in March and up substantially from 3.8 in April of 2014. This is the highest months of supply has been since July, 2012

chart.

Market Time

Days on market of 150 in April was way up from 46 in March and up a little from 130 in April of 2014.

chart

Change in Median Sale Price for Single Family Properties YTD From 2014 To 2015 for Towns in Middlesex County Ranked by Best Performance
Town % Change
Cambridge 38.46%
Newton 24.92%
Stoneham 21.81%
Lowell 14.80%
Malden 14.72%
Hopkinton 13.40%
Wilmington 13.33%
Woburn 13.00%
Melrose 12.05%
Billerica 10.71%


SUDBURY, MA : MARKET DATA THROUGH APRIL

April Headlines

Sudbury
  • 3-month unit sales are up by 32.1%.
  • 3-month inventory is up 9.1% to 84.
  • New listings in April were 53. This is down 13.1% from 61 in April of 2014.
Nearby Areas You May Be Interested In
  • Unit sales in Medfield are up 90.0% to 19.
  • Months of supply in Bedford in April was 4.5. This is up 92.4% from 2.4 in April of 2014.
  • Median price in Bedford is up by 50.5%.
Changes Favoring Buyers
3 Months Ending April, 2015 % Chg From Apr, 2014
Inventory 84 9.1%
Months of Supply 4.3 3.4%
New Listings 108 5.9%
Changes Favoring Sellers
3 Months Ending April, 2015 % Chg From Apr, 2014
Unit Sales 37 32.1%
Median Sale Price $625,000 2.0%
Market Time (Days) 110 -10.6%
Price per Sq Ft for Sold $258 2.6%
Sales to List Price Ratio 98.9% 2.0%
Listings Under Contract 46 4.5%

Sales

There were 17 unit sales in April. This is up 6.3% from 16 in April of 2014. Sales/list price ratio in April moved down to 97.9% from 100.9% in March.

chart

Prices

Median price in April was $640,000. This is down 3.0% from $660,000 in April of 2014. 3-month median price of $625,000 in April was up just slightly from $615,000 in March and very slightly up from $612,750 in April of 2014. Price per square foot in April was $253. This is down from $267 in March but up from $243 in April of 2014.

chart

Inventory

Inventory of 112 in April was up 34.9% from 83 in March and up 9.8% from 102 in April of 2014. New listings of 53 in April were up somewhat from 43 in March but down modestly from 61 in April of 2014. Months of supply in April was 5.6, unchanged from the same month last year. This is the highest months of supply has been since September, 2014.

chart

Market Time

Days on market of 92 in April was down moderately from 117 in March and down considerably from 123 in April of 2014. This is the lowest days on market has been since September, 2014.

chart

Change in Median Sale Price for Single Family Properties YTD From 2014 To 2015 for Towns in Middlesex County Ranked by Best Performance
Town % Change
Cambridge 38.46%
Newton 24.92%
Stoneham 21.81%
Lowell 14.80%
Malden 14.72%
Hopkinton 13.40%
Wilmington 13.33%
Woburn 13.00%
Melrose 12.05%
Billerica 10.71%

SHERBORN, MA : MARKET DATA THROUGH APRIL

April Headlines

Sherborn
  • No significant changes.
Nearby Areas You May Be Interested In
  • Days on market in Needham is up 276.9% to 98.
  • Unit sales in Medfield in April were 19. This is up 90.0% from 10 in April of 2014.
  • Days on market in Westwood is up by 393.3%.
Changes Favoring Buyers
3 Months Ending April, 2015 % Chg From Apr, 2014
Median Sale Price $750,000 -16.2%
Market Time (Days) 173 57.3%
Price per Sq Ft for Sold $258 -0.4%
Sales to List Price Ratio 95.4% -0.6%
Listings Under Contract 15 -16.7%
Changes Favoring Sellers
3 Months Ending April, 2015 % Chg From Apr, 2014
Unit Sales 13 85.7%
Inventory 37 -14.0%
Months of Supply 8.8 -4.7%
New Listings 37 -9.8%

Sales

There were 5 unit sales in April. This is up 150.0% from 2 in April of 2014. Sales/list price ratio in April moved up to 100.0% from 93.2% in March.

chart

Prices

Median price in April was $790,000. This is up 38.5% from $570,500 in April of 2014. 3-month median price of $750,000 in April was up marginally from $740,000 in March but down modestly from $895,000 in April of 2014. Price per square foot in April was $280. This is up from $241 in March but down from $295 in April of 2014.

chart

Inventory

Inventory of 45 in April was up 40.6% from 32 in March but down 8.2% from 49 in April of 2014. New listings of 17 in April were up considerably from 11 in March but down slightly from 19 in April of 2014. Months of supply of 10.2 in April was up moderately from 7.7 in March but down a little from 10.5 in April of 2014. This is the highest months of supply has been since July, 2014.

chart

Market Time

Days on market of 130 in April was down somewhat from 191 in March but up substantially from 82 in April of 2014.

chart

Change in Median Sale Price for Single Family Properties YTD From 2014 To 2015 for Towns in Middlesex County Ranked by Best Performance
Town % Change
Cambridge 38.46%
Newton 24.92%
Stoneham 21.81%
Lowell 14.80%
Malden 14.72%
Hopkinton 13.40%
Wilmington 13.33%
Woburn 13.00%
Melrose 12.05%
Billerica 10.71%

NEWTON, MA : MARKET DATA THROUGH APRIL

April Headlines

Newton
  • 3-month median price is up 26.8% to $1,191,568.
  • Months of supply in April was 3.8. This is up 22.5% from 3.1 in April of 2014.
  • Year-to-Date new listings are down by 12.6%.
Nearby Areas You May Be Interested In
  • Days on market in Needham is up 276.9% to 98.
  • Months of supply in Winchester in April was 4.4. This is up 109.1% from 2.1 in April of 2014.
  • Inventory in Winchester is up by 71.8%
Changes Favoring Buyers
3 Months Ending April, 2015 % Chg From Apr, 2014
Unit Sales 82 -10.9%
Months of Supply 2.8 8.2%
Market Time (Days) 84 33.3%
Sales to List Price Ratio 98.0% -0.5%
Listings Under Contract 133 -20.4%
 Changes Favoring Sellers
3 Months Ending April, 2015 % Chg From Apr, 2014
Median Sale Price $1,191,568 26.8%
Inventory 134 -2.2%
Price per Sq Ft for Sold $400 7.7%
New Listings 246 -12.1%

Sales

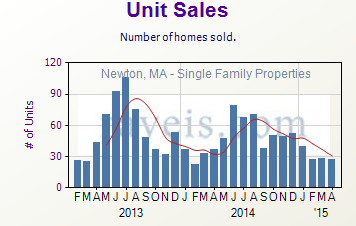
There were 27 unit sales in April. This is down 27.0% from 37 in April of 2014. This is the lowest unit sales have been since 22 in February, 2014. Sales/list price ratio in April moved down to 98.6% from 99.1% in March.

chart

Prices

Median price in April was $1,200,000. This is up 12.9% from $1,062,500 in April of 2014. 3-month median price of $1,191,568 in April was very slightly up from $1,145,000 in March and up somewhat from $940,000 in April of 2014. Price per square foot in April was $402. This is up from $394 in March and up from $375 in April of 2014.

chart

Inventory

Inventory of 184 in April was up 48.4% from 124 in March and up 9.5% from 168 in April of 2014. New listings of 128 in April were up substantially from 90 in March and very slightly up from 122 in April of 2014. Months of supply of 3.8 in April was way up from 2.5 in March and up moderately from 3.1 in April of 2014. This is the highest months of supply has been since October, 2014.

chart

Market Time

Days on market of 94 in April was up a little from 81 in March and way up from 62 in April of 2014. This is the highest days on market has been since February, 2013.

chart

Change in Median Sale Price for Single Family Properties YTD From 2014 To 2015 for Towns in Middlesex County Ranked by Best Performance
Town % Change
Cambridge 38.46%
Newton 24.92%
Stoneham 21.81%
Lowell 14.80%
Malden 14.72%
Hopkinton 13.40%
Wilmington 13.33%
Woburn 13.00%
Melrose 12.05%
Billerica 10.71%