

April Headlines
- Days on market in Needham is up 276.9% to 98.
- Months of supply in Winchester in April was 4.4. This is up 109.1% from 2.1 in April of 2014.
- Inventory in Winchester is up by 71.8%
| Changes Favoring Buyers | ||
| 3 Months Ending | April, 2015 | % Chg From Apr, 2014 |
| Unit Sales | 82 | -10.9% |
| Months of Supply | 2.8 | 8.2% |
| Market Time (Days) | 84 | 33.3% |
| Sales to List Price Ratio | 98.0% | -0.5% |
| Listings Under Contract | 133 | -20.4% |
| Changes Favoring Sellers | ||
| 3 Months Ending | April, 2015 | % Chg From Apr, 2014 |
| Median Sale Price | $1,191,568 | 26.8% |
| Inventory | 134 | -2.2% |
| Price per Sq Ft for Sold | $400 | 7.7% |
| New Listings | 246 | -12.1% |
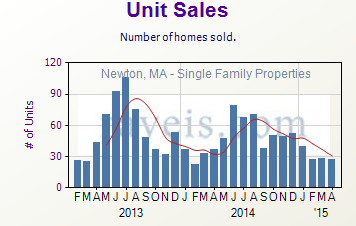
Sales
There were 27 unit sales in April. This is down 27.0% from 37 in April of 2014. This is the lowest unit sales have been since 22 in February, 2014. Sales/list price ratio in April moved down to 98.6% from 99.1% in March.

Prices
Median price in April was $1,200,000. This is up 12.9% from $1,062,500 in April of 2014. 3-month median price of $1,191,568 in April was very slightly up from $1,145,000 in March and up somewhat from $940,000 in April of 2014. Price per square foot in April was $402. This is up from $394 in March and up from $375 in April of 2014.

Inventory
Inventory of 184 in April was up 48.4% from 124 in March and up 9.5% from 168 in April of 2014. New listings of 128 in April were up substantially from 90 in March and very slightly up from 122 in April of 2014. Months of supply of 3.8 in April was way up from 2.5 in March and up moderately from 3.1 in April of 2014. This is the highest months of supply has been since October, 2014.

Market Time
Days on market of 94 in April was up a little from 81 in March and way up from 62 in April of 2014. This is the highest days on market has been since February, 2013.

| Change in Median Sale Price for Single Family Properties YTD From 2014 To 2015 for Towns in Middlesex County Ranked by Best Performance | |
| Town | % Change |
| Cambridge | 38.46% |
| Newton | 24.92% |
| Stoneham | 21.81% |
| Lowell | 14.80% |
| Malden | 14.72% |
| Hopkinton | 13.40% |
| Wilmington | 13.33% |
| Woburn | 13.00% |
| Melrose | 12.05% |
| Billerica | 10.71% |
